EssilorLuxottica

Background
EssilorLuxottica is the a global leader in vision care, specializing in the design, manufacture, and distribution of eyewear, lenses, and optical solutions.
Objective
EssilorLuxottica aimed to enhance their on-time delivery performance analysis by developing a comprehensive reporting system. The goal was to create a new report that could incorporate additional parameters, including data from external labs, international agencies, and the primary laboratory in Italy. This unified report provided deeper insights to support better decision-making and align global supply chain stakeholders.
Tech Stack
Source System: SAP S/4HANA
Database: SAP HANA
Data Warehouse: SAP BW/4HANA
Connectivity: ODP, Smart Data Access (SDA)
ETL Process
Extract: ODP
Transform: ABAP/AMDP TRNFs, Calculation Views
Load: ADSOs populated via DTPs
Front-end Reporting
SAP Business Object Web Intelligence
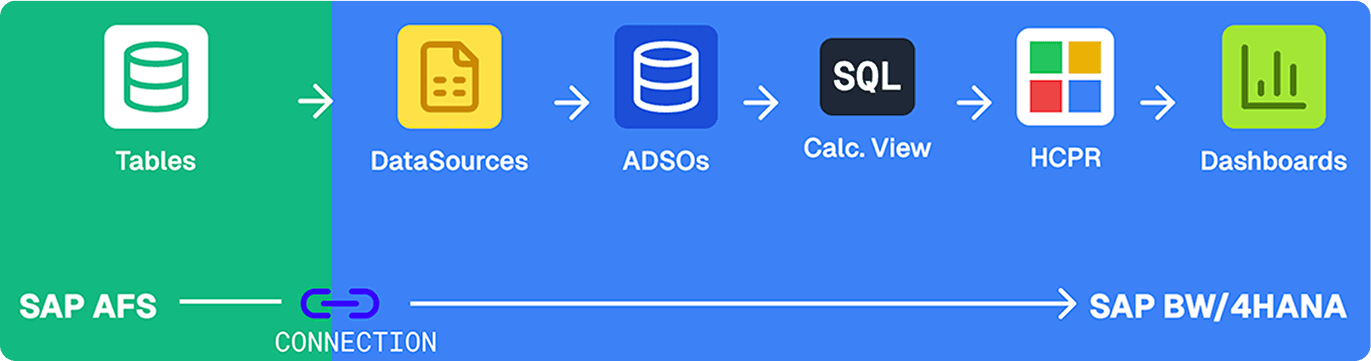
Data Flow
The following data flow is a simplified representation of the project’s ETL process.
The source system for this flow is SAP AFS. Multiple ADSOs (Advanced Data Store Objects) were created to organize and manage the data. Among these, the Consolidation ADSO serves as the central repository, consolidating all the necessary information.
Data from the Consolidation ADSO was then utilized in a Calculation View, where it underwent enrichment and various manipulations. This enriched and transformed data was subsequently incorporated into an SAP HANA Composite Provider, which served as a unified data model. Finally, the Composite Provider was leveraged in SAP BusinessObjects for reporting and analysis.
About the Dashboards
The dashboards below are examples of a series of dashboards created and used daily by stakeholders. These dashboards provide actionable insights by tracking key performance indicators (KPIs), such as on-time delivery rates. They enable decision-makers to identify bottlenecks, optimize supply chain operations, and achieve delivery targets. Additionally, the dashboards are regularly distributed to stakeholders via email for seamless access.
Disclaimer: Please note that the data displayed on these dashboards are sample data to ensure privacy and confidentiality.
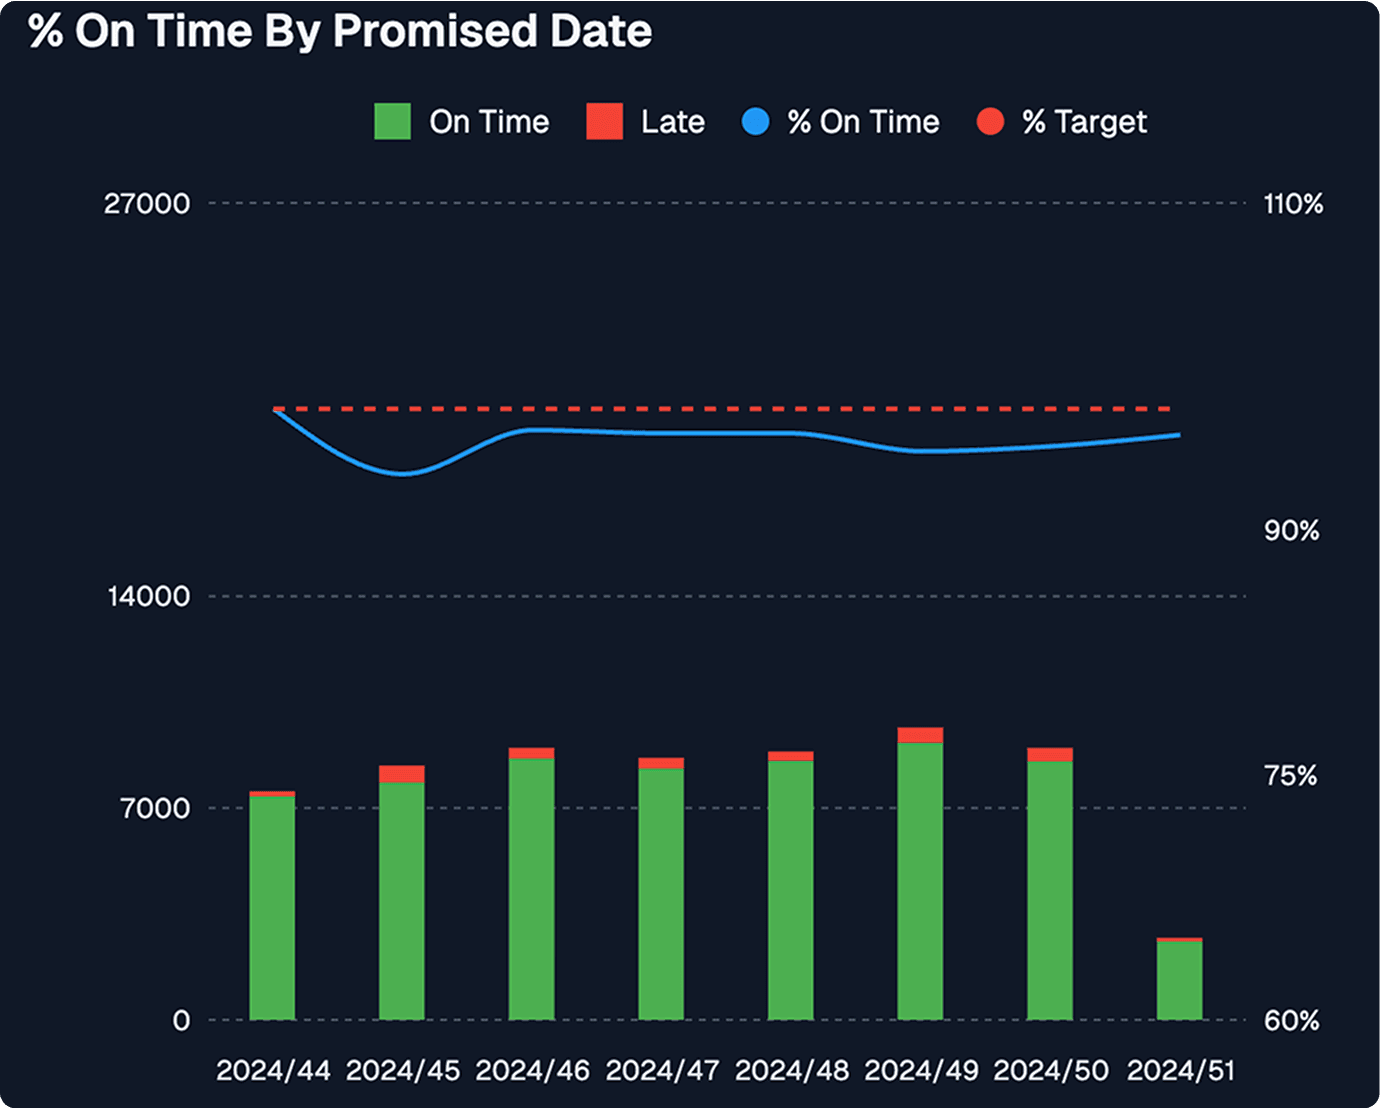
Dashboard 1
This dashboard visualizes weekly aggregated order volumes categorized into On Time and Late, along with the on-time percentage trend against the target. The % Target represents the required on-time delivery rate to meet goals. This is one of 20 similar dashboards, each with varying filters, groupings, or analysis types, such as for different brands.
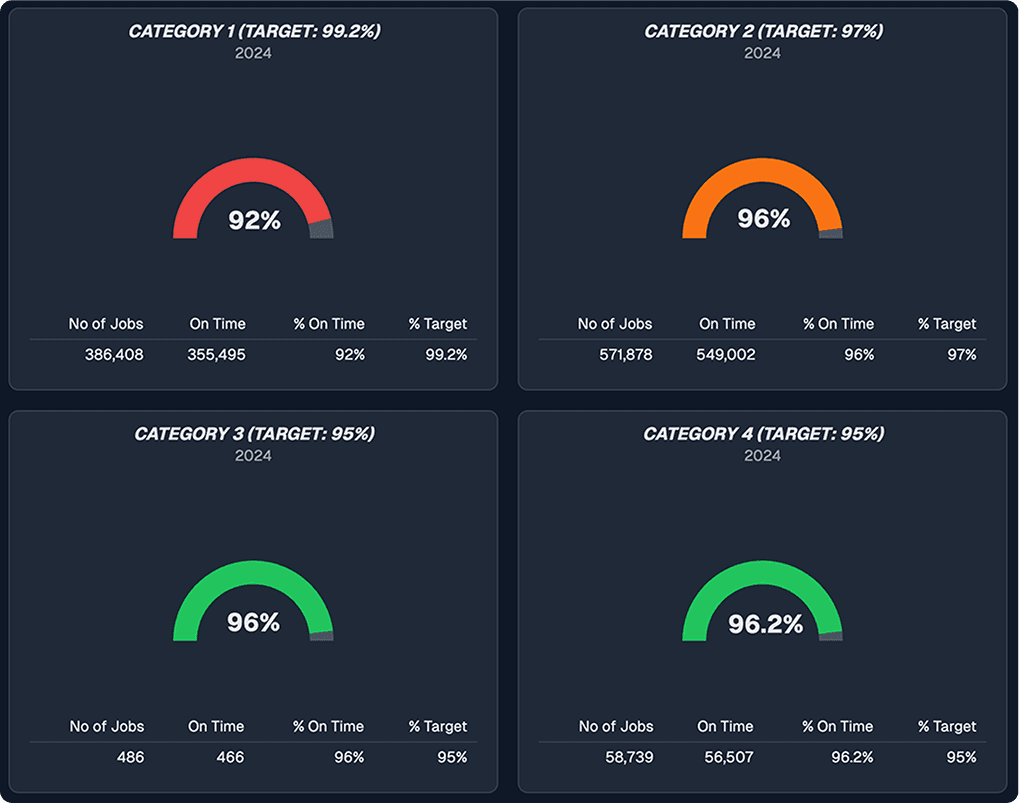
Dashboard 2
This dashboard represents the year-to-date (YTD) on-time delivery performance across different categories (with the actual project categories hidden for demonstration purposes). Each quadrant provides a breakdown of performance compared to specific targets set for 2024.
Conclusion
The dashboard has been successfully implemented and is actively used by stakeholders to track on-time delivery performance. While it provides visibility into key metrics, further evaluation is needed to assess its impact on decision-making and operational improvements. Future enhancements may include refining data accuracy, integrating predictive analytics, and gathering stakeholder feedback to optimize its effectiveness.